Scattered records, in one place
We bring records that sat in separate places into one, in a form your staff can use every day.

Wellness, GPS, match and medical records in one place, with the analysis delivered as a web app your staff use every day.
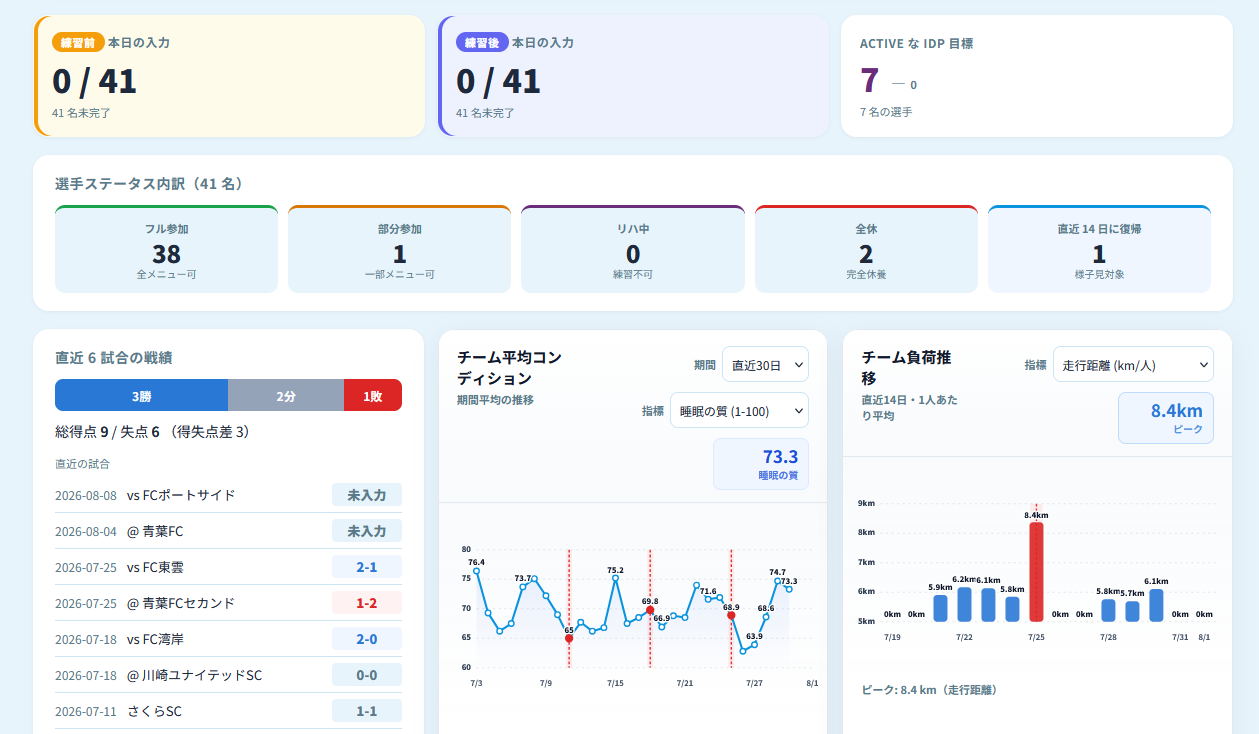
We bring records that sat in separate places into one, in a form your staff can use every day.
Everything the squad does, recorded in one place. Put data in, and prediction and analysis come back.
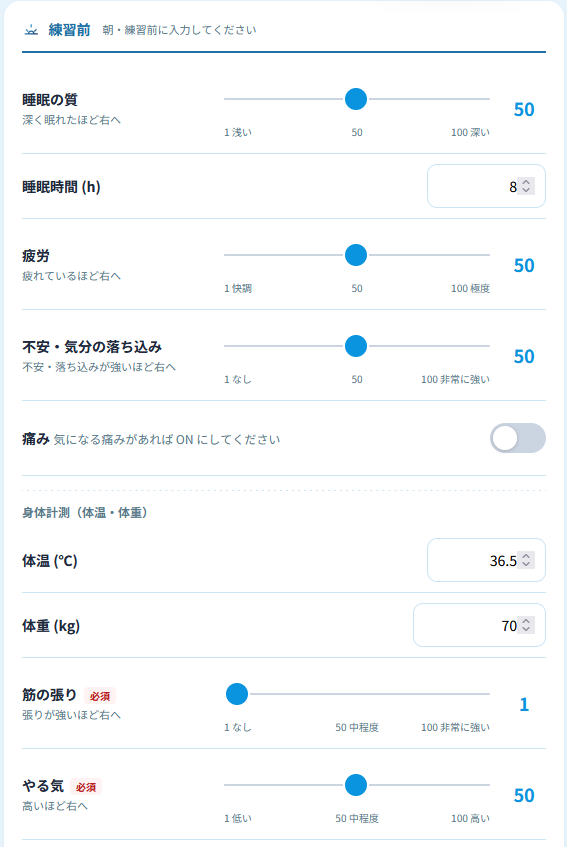
Twice a day, before and after training, mostly on sliders. Pain sites and club-specific fields are supported. This is the base every analysis rests on.
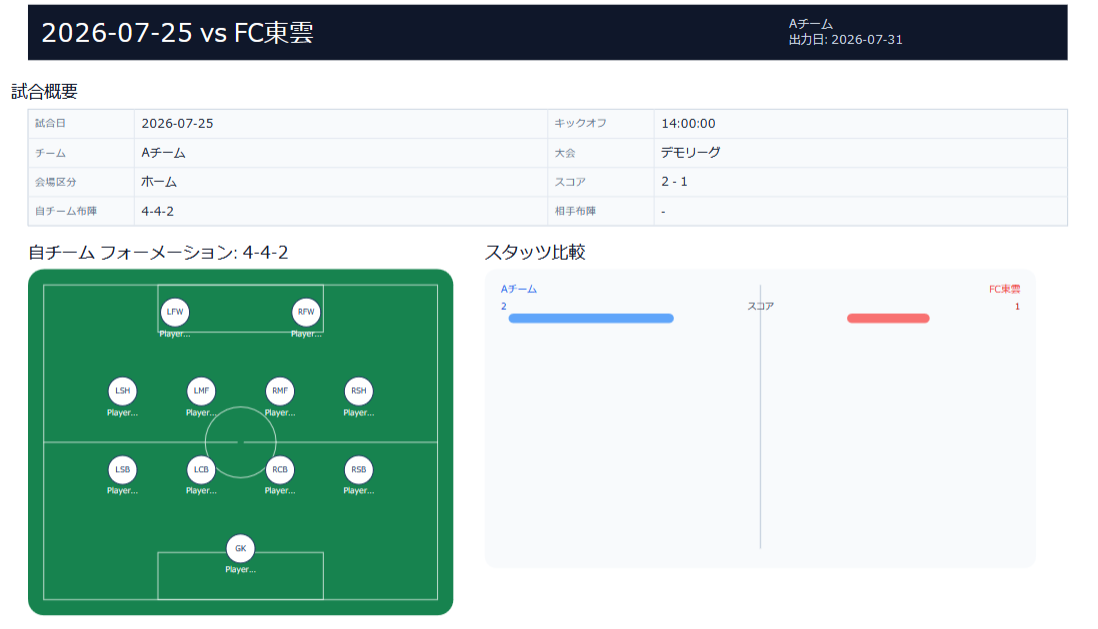
Not just score and opponent, but minutes, statistics and each player’s self-assessment — match by match, so you can go back to it.
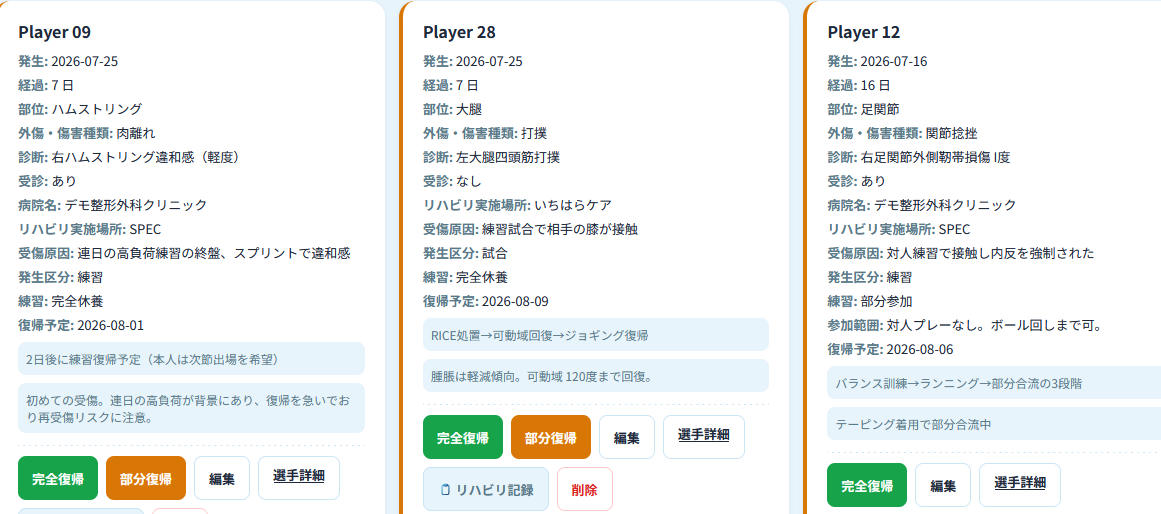
Who was injured, when, where, and when they returned, kept as the squad’s record. Rehabilitation progress and partial participation are recorded too.
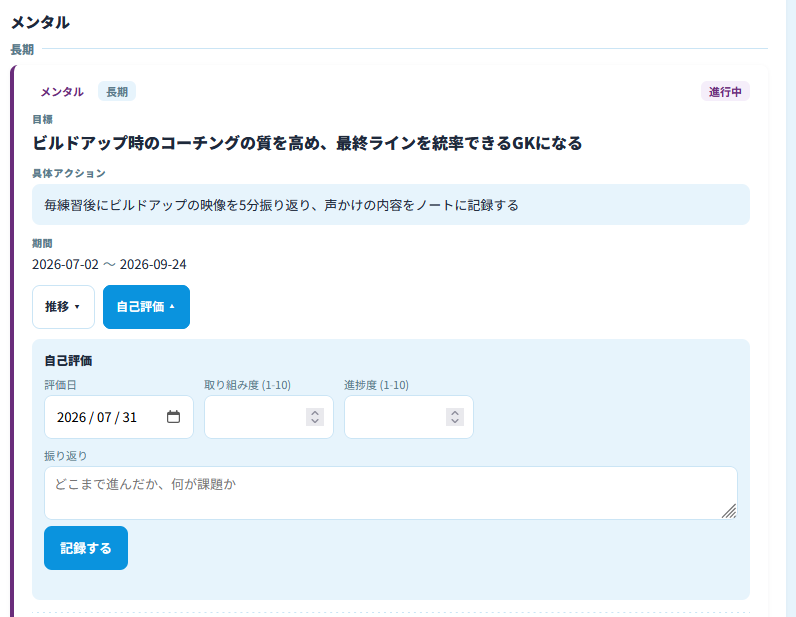
Goals and actions per player, with progress reviews and meeting notes in the same place. The development process, kept visible.
From building the session to sending it to players. Templates and a drill library mean it gets quicker the more you use it.
Total distance, sprints, accelerations, impacts and ACWR pulled in automatically over an API and charted.
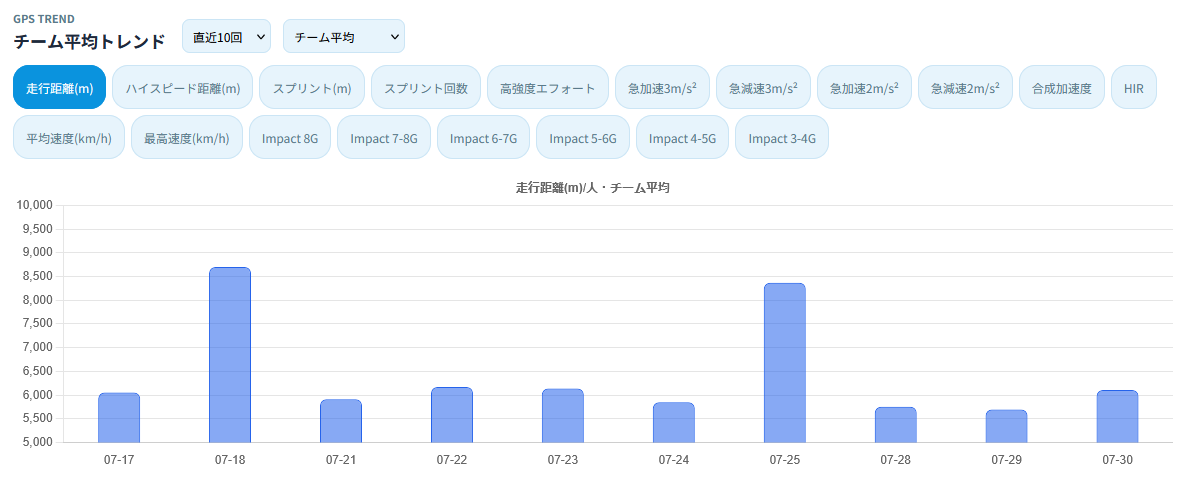 GPS-integrated clubs only
“We want to record this too”, “we want to bring this data in” — club-specific fields and new data types can be built in on request.
Records that sat apart, lined up against the same player and the same timeline.
Check-in status, player status, results, wellness and load trends at a glance. Being able to read across the same player is where every decision starts.
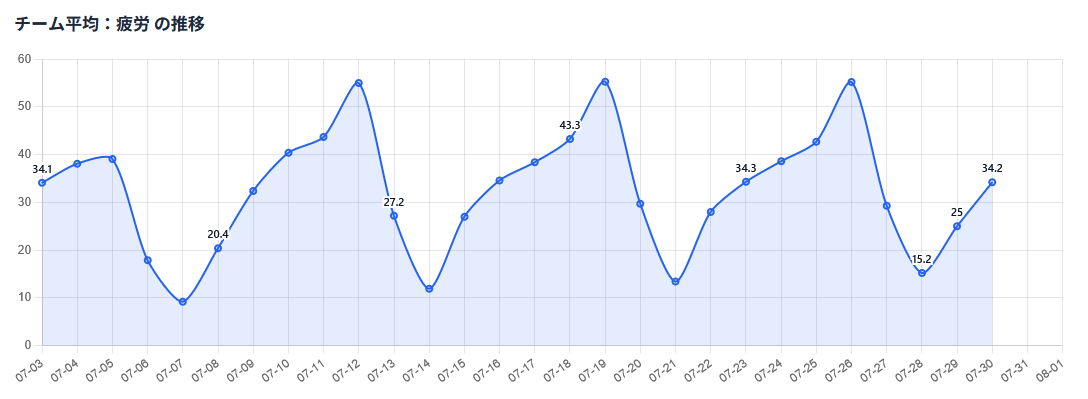
Each indicator charted over time. Pick a period and a metric, and the swings are immediately visible.
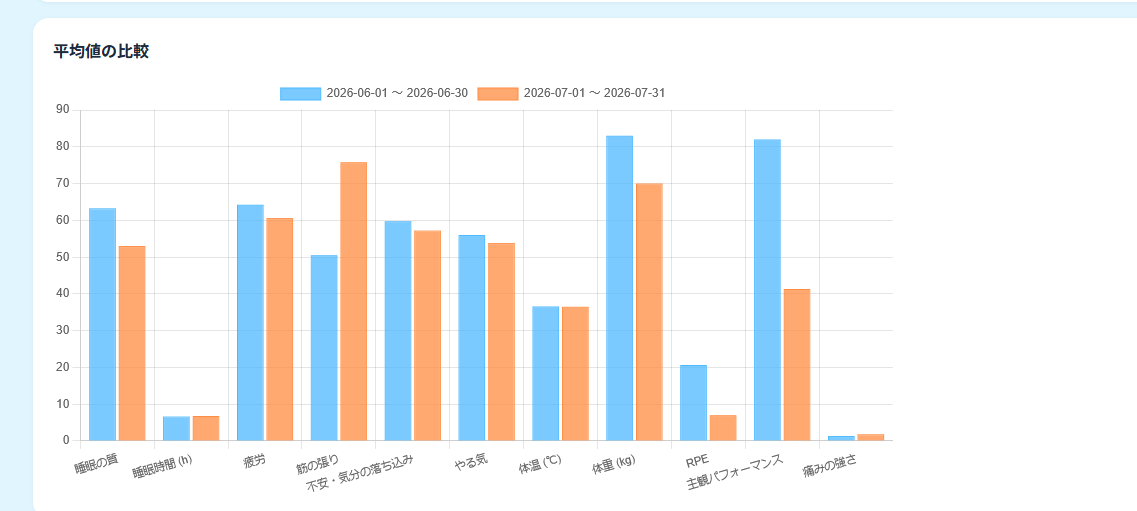
Before and after an injury, a good run against a poor one — two periods side by side, so you can see what changed.
A daily injury risk prediction, and network analysis of how the indicators relate.
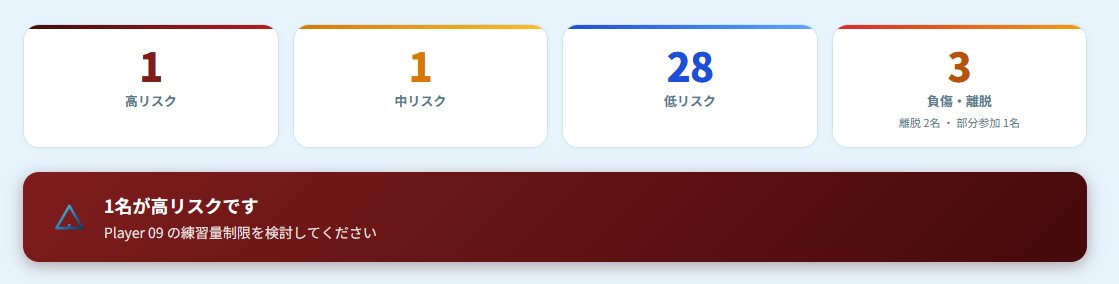
A daily risk score for every player. How many are high, medium and low risk, and who needs attention, at a glance.
Why a player is high risk, broken down by factor. You can see the reasoning, so you can act on it.

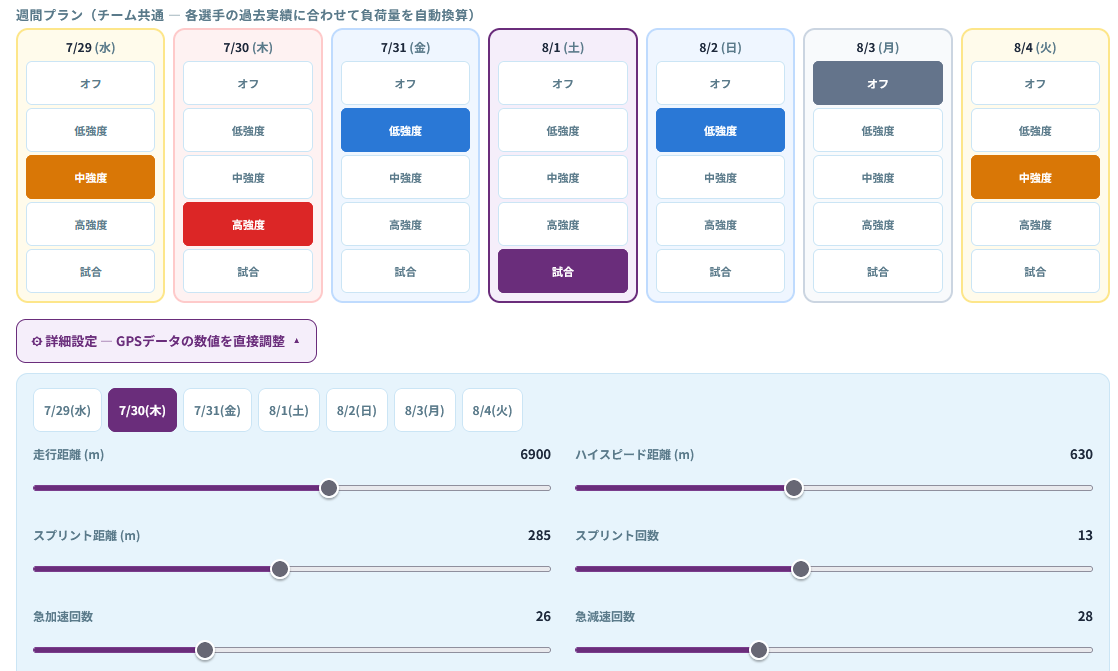
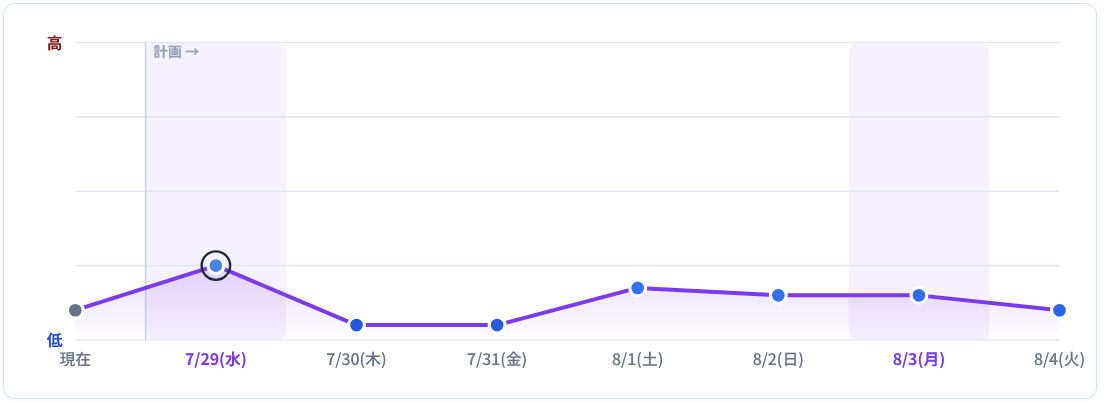
Build the week’s intensities and see how risk moves over the next seven days before you commit to it.
How last night’s sleep affects today’s fatigue. Effects that carry across days, shown as arrows.
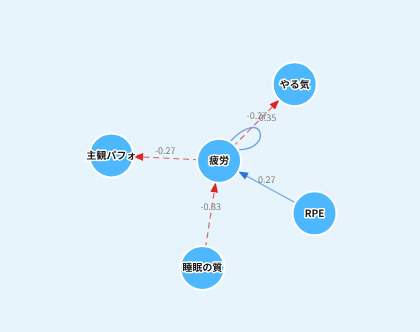
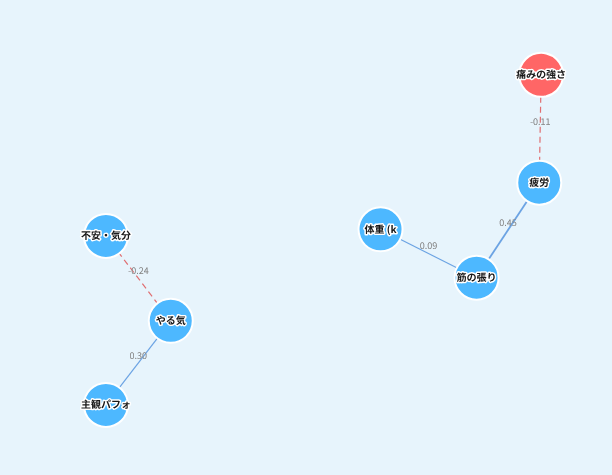
Which indicators move together on the same day. The structure of a player’s condition starts to show.
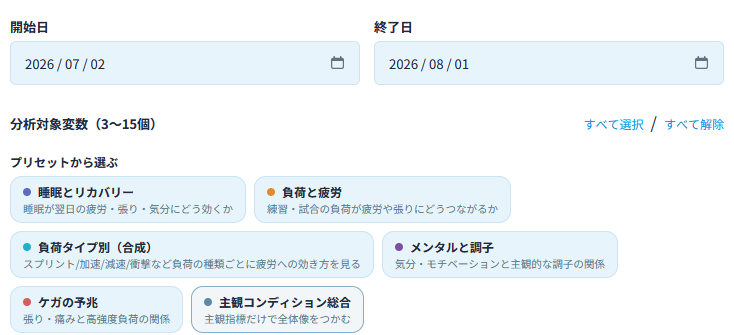
Sleep and recovery, early signs of injury — pick a preset. No specialist knowledge needed to build the diagram you want.
It is not limited to what ships with the platform. Findings from analysis built on your own data (Data Analysis & Advisory) can be implemented in these screens, so work done for your club ends up in daily use.
This does not guarantee that injuries are prevented; it is there to support the decision. Limited to muscular, non-contact ligament and overuse injuries. The figures come from the pilot with University of Tsukuba Football Club and will differ with the club and the data available.
| Feature | What it does |
|---|---|
| Wellness | Self-reported check-in before and after training (mostly sliders, about a minute), pain sites, club-specific fields, entry on a player’s behalf |
| GPS data | Total distance, sprints, accelerations and ACWR pulled in over an API and charted (GPS-integrated clubs only) |
| Medical and rehabilitation | Injury and return-to-play records, rehabilitation progress, partial participation, injury summaries |
| Match and training records | Minutes, statistics and self-assessment; building, sharing and exporting sessions; a drill library |
| Individual Development Plans | Goals, progress reviews and meeting notes in one place, with summaries |
| Schedule | Calendar for training and fixtures, switchable by squad |
| Dashboard | Squad overview, automatic alerts for players needing attention, player list, profile radar |
| Injury risk prediction | Risk score per player (daily and weekly), factor breakdown, weekly plan (GPS-integrated clubs only) |
| Network analysis | Lead–lag and concurrent relationships, two-period comparison, squad tendencies, generated readings |
| Custom analysis | Findings from analysis built on your own data (Data Analysis & Advisory) implemented in the platform screens |
| New inputs | Club-specific fields and new data types built in on request |
Importing historical data from spreadsheets, GPS software or paper can be scoped with you. Club-specific input fields can be added as well.
How we handle wellness and medical data is documented in our privacy policy.
We can show you the screens themselves, and shape a pilot around where your club is. Once you are set up, we walk your staff through it directly.