


Read the relationships, not just the numbers.

One metric on its own will not tell you what a player needs. Rather than reading GPS, wellness, injury history and match data separately, we read the relationships between them.

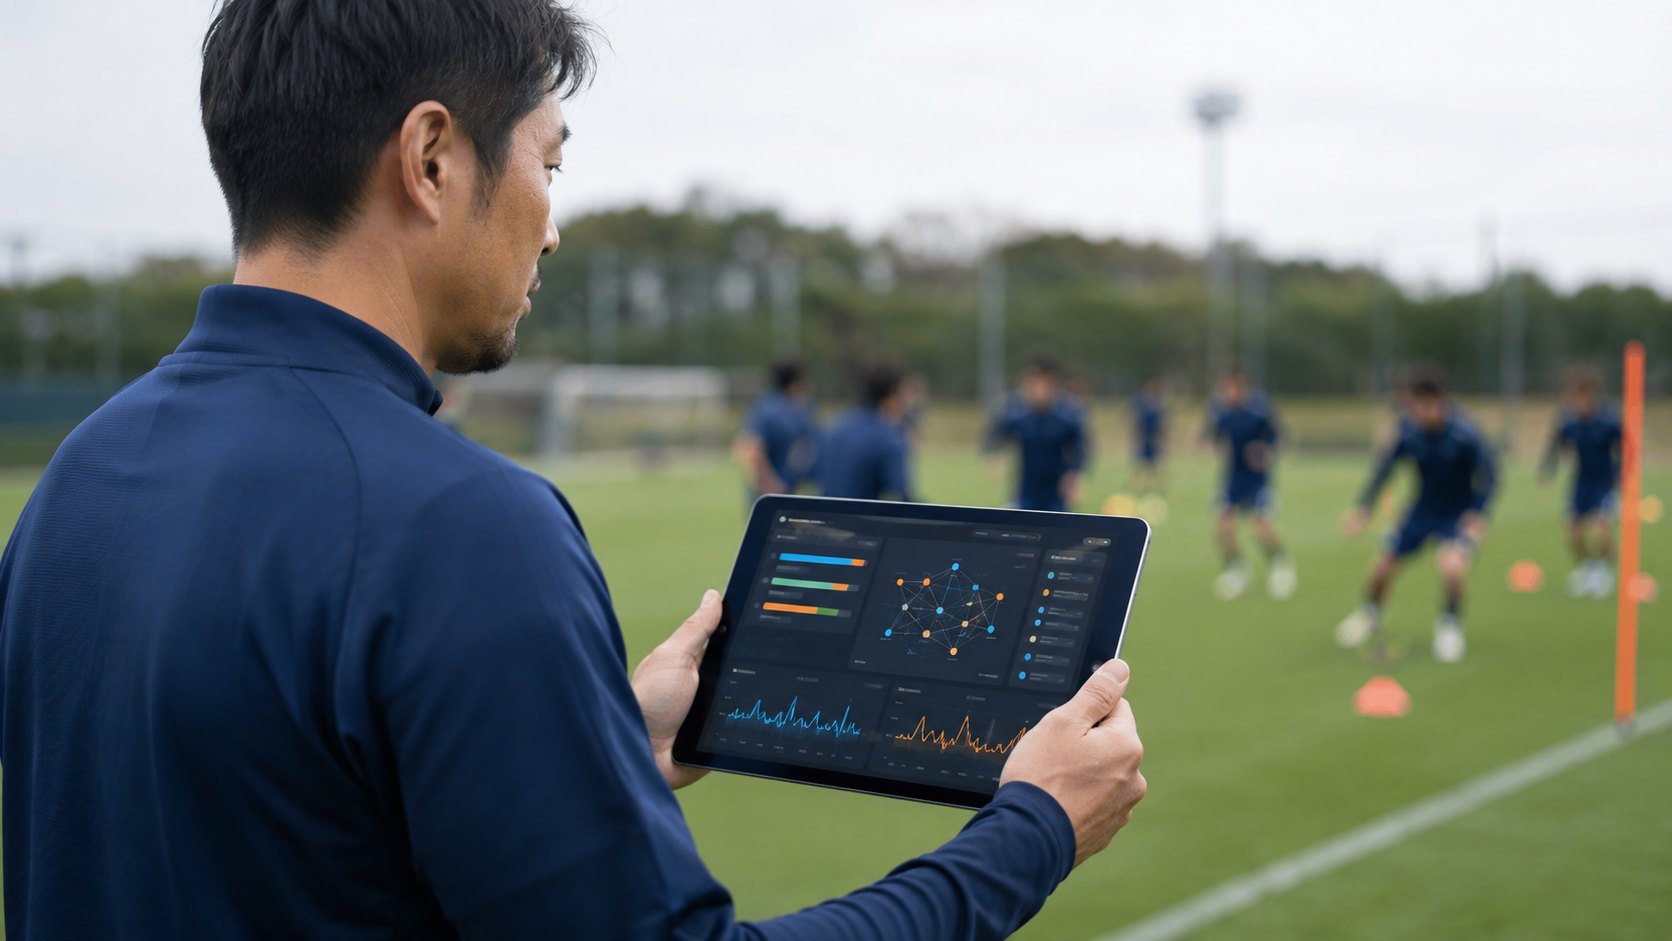
A coach checking a dashboard on a tablet beside the pitch, with players training in the background

About

About Odonata

Odonata was founded by researchers in doctoral programmes at the University of Tsukuba, together with people who have worked in football themselves.

Football clubs generate records every day — wellness, GPS, match, medical, development plans. In most clubs these sit in separate places and accumulate without ever being connected.

We reconnect those records and run analysis that single metrics cannot reach. We then deliver that analysis as a web app your staff can use in daily decisions.

Research, analysis and engineering all sit inside the same team.

More about the team

Staff reviewing squad and player data across several analysis screens

Service

What we do

You can start from the analysis, or from the platform.

Two people going through an analysis report spread out on a desk
Service 01

Data Analysis & Advisory

We analyse the data your club already holds and build models and findings specific to your players.

  • Organising and analysing the data you already hold
  • Injury risk models built for your squad
  • Network analysis reports

Data Analysis & Advisory

An analysis room with network diagrams and charts on large monitors, a floodlit pitch visible outside
Service 02

Data Platform

We collect and organise daily data, and deliver the analysis as a web app your staff use every day.

  • Collectwellness, GPS, match, medical, IDP
  • Organiseone view, per player and per squad
  • Interpretinjury risk prediction and network analysis

Data Platform

Photographs are for illustration only.

What we can find in your data

These are the outputs we have built so far. What can be analysed grows with the combinations of data available.

Injury risk prediction

~70%Precision

Compared with the conventional ACWR indicator
MetricACWR (conventional)Odonata
Precision ~5%~70%
Recall ~20%~20%

Recall stays at the same level as the conventional metric, while precision rises from ~5% to ~70%.

Around 70% of the players we flagged as high risk went on to sustain an injury. The app also shows the contributing factors and a suggested adjustment to training load.

Validated on University of Tsukuba Football Club data from 2022–2025. Limited to muscular, non-contact ligament and overuse injuries.
Network analysis

Network diagram of the relationships between indicators Five indicators — sleep, fatigue, muscle tightness, total distance and motivation — connected by lines. Line thickness shows the strength of the relationship. motivation sleep distance fatigue tightness How indicators connect differs by player

Line thickness shows the strength of the relationship

Two players can do the same session and feel it in different places. We map the relationships between wellness, GPS, match and medical indicators, and read the pattern specific to that player.

Other analyses

Themes still to come

We also run analyses shaped by the combination of data available.

  • Wellness × match statistics We connected daily wellness records and GPS load data to match statistics.
    • What matters is accumulation, not the day before. Running load over the previous 8–14 days lowers duel win rate
    • Some players drop under load and some do not. Adjustment can be optimised player by player
    • Perceived fatigue has an independent effect even after accounting for GPS load. The daily check-in has value in itself
    • In weeks where load and fatigue overlapped, duel win rate fell by ~16 percentage points on average (39% → 23%)
  • Wellness × GPS We looked at how training load shows up in a player’s state the following day.
    • Training load raises physical fatigue the following day
    • The size of that response varies widely between players. Some react strongly to the same session; others barely at all
    • Psychological wellness stays relatively stable, while physical wellness moves a great deal
    • When psychological wellness is good, physical wellness the next day is also better
  • IDP × match statistics Testing whether the goals set for a player translate into change on the pitch.

    In progress

All estimates are from University of Tsukuba Football Club data. Results will differ depending on the club and the data available.

…and more. We design the analysis around each club.

Why we can find it

Complex Systems Approach

Rather than reading indicators one at a time, we treat the relationships between them as the unit of analysis.

Take injury as one example. Factors that each sit within normal range can combine into a dangerous one.

Trainingload Wellnessindicators Schedule Injury history within normal rangewithin normal range within normal rangewithin normal range Injury dangerous when they combine (example)

Factors that show nothing unusual on their own can still combine into a dangerous state.
The same structure applies to swings in performance, and to how a player develops.

Injury and performance are not decided by GPS alone, by fatigue alone, or by match statistics alone.

How the complex systems approach works

The data we connect

There is no fixed set. Any record your club already keeps can be a starting point.

  • Wellnesssleep, fatigue, soreness
  • GPStotal distance, sprints
  • Trainingload, content, attendance
  • Matchesminutes, statistics
  • Medicalinjuries, return to play, history
  • Player developmentgoals, reviews, assessments
  • Physical testingmeasurements and trends
  • Growthheight, weight, maturation
  • Oppositionscouting, previous meetings
  • Psychologicalmotivation, anxiety, mood
  • Anything elsewhatever your club records — the format does not matter

You can start with the data you already have.

No new hardware required. Paper and spreadsheets are a fine starting point.

Why we build the platform too

So the analysis does not stop at a report. It gets used, data accumulates, and new findings follow.

A five-stage cycle: analyse, findings emerge, implement, staff use it, data accumulates, and back to analyse The centre reads that the more it is used, the sharper it gets. The arrow returning from the accumulation stage to the analysis stage is drawn thicker, to show that accumulation drives the next finding. accumulation drives the next finding The more it is used, the sharper it gets. 1
Analyseyour existing data, with a complex systems approach
2
Findings emergerelationships single metrics cannot show
3
Implementthe analysis goes into the platform
4
Staff use itin daily decisions
5
Data accumulatesthe more it is used, the more records build up
  1. 1Analyseyour existing data, with a complex systems approach
  2. 2Findings emergerelationships single metrics cannot show
  3. 3Implementthe analysis goes into the platform
  4. 4Staff use itin daily decisions
  5. 5Data accumulatesthe more it is used, the more records build up
  6. Back to 1accumulation drives the next finding

The more it is used,
the sharper it gets.

What this cycle produces

The darker colour marks what we already deliver. The rest are themes still to come.

The more combinations of data, the more themes become possible.

In use at University of Tsukuba Football Club, where we continue to validate.

The platform has been in daily use since June 2026 in a top-level university environment. We continue to validate model accuracy alongside it.

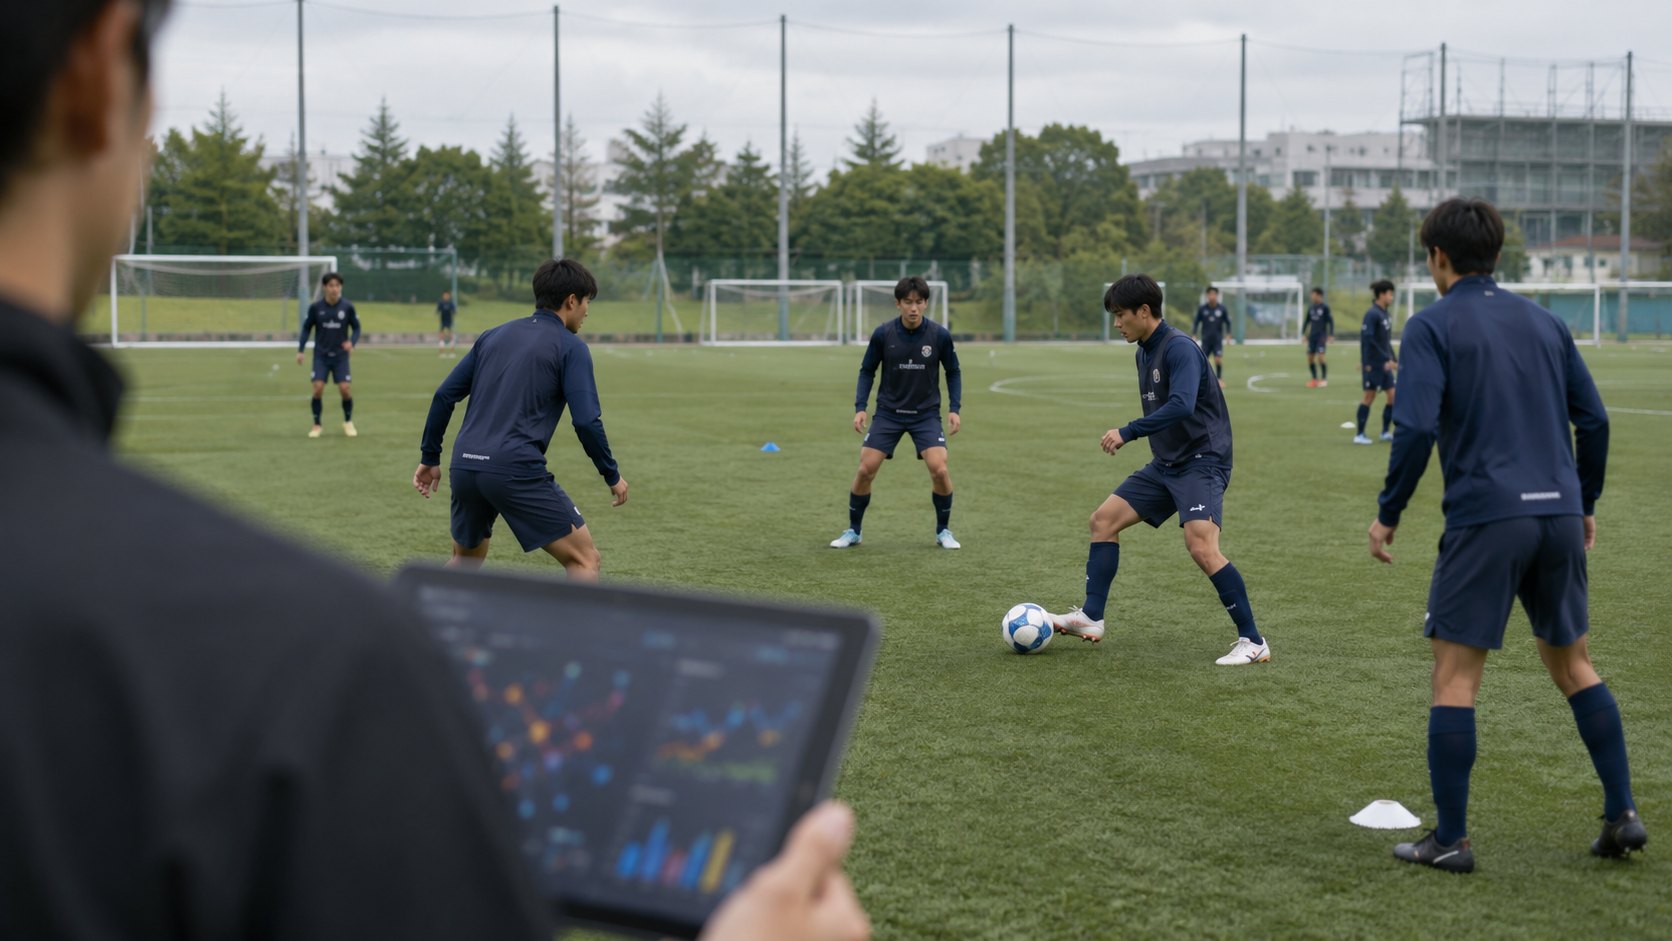
Players running a passing drill on the training ground, with a staff member looking at a tablet in the foreground
Photographs are for illustration only.

What we validated

We combined self-reported wellness, GPS, schedule and injury history from 2022–2025, generated features across more than 200 views of the data, and trained a model to recognise states resembling those that preceded past injuries. It produces a daily injury risk score for each player.

How this compares with ACWR

ACWR (acute:chronic workload ratio) has been the conventional way to flag injury risk. It judges risk from a single ratio — how sharply recent load has risen against the longer-term average.

Precision and recall compared between ACWR and Odonata
Metric What it means ACWR (conventional) Odonata
Precision Of the players flagged as high risk, the share who went on to be injured ~5% ~70%
Recall Of the injuries that occurred, the share flagged in advance ~20% ~20%

Recall stays at the same level as the conventional metric, while precision rises from ~5% to ~70%.

In practical terms: of ten players flagged for attention, fewer than one used to go on to be injured. Now seven do.

How these numbers are calculated

Breakdown of the 100 players validated

  • Flagged high risk and injured (true positive): 7
  • Flagged high risk but not injured (false positive): 3
  • Flagged low risk but injured (missed): 28
  • Flagged low risk and not injured (true negative): 62

Precision = 7 ÷ (7 + 3) = ~70%
Recall = 7 ÷ (7 + 28) = ~20%

  • Validated on University of Tsukuba Football Club data from 2022–2025.
  • Limited to muscular, non-contact ligament and overuse injuries (including stress fractures).
  • Within a single model, precision and recall trade off against each other. Raising one tends to lower the other.
  • Results will differ with the volume and quality of data, and with the club. We validate and tune on each club’s own data.

See the full results

Research, the touchline, and engineering — in one team.

Research

Doctoral research at the University of Tsukuba, in cognitive psychology, neuroscience and clinical psychology.

Football

Playing and coaching experience with University of Tsukuba Football Club.

Engineering

Built by a member specialising in information engineering. Requests from your staff can be reflected quickly.

HY
Lead / Research

Haruki Yokota

Doctoral programme (Psychology), University of Tsukuba. Cognitive psychology and neuroscience. Playing and coaching experience with University of Tsukuba Football Club.

KO
Engineering / Research

Kazuya Ohuchi

Doctoral programme (Systems and Information Engineering), University of Tsukuba. Brain information science and cognitive neuroscience. Leads product development at Odonata.

KH
Research

Keigo Hatto

Doctoral programme (Psychology / Clinical Psychology), University of Tsukuba. Clinical and sport psychology. Certified clinical psychologist. Researches the psychological network approach applied to athlete conditioning.

+
Business

Other members

University of Tsukuba graduate. Background in B2B advertising sales and new business development.

Start small. Build it with your staff.

  1. STEP 1

    Initial conversation

    We ask what data you already have, and what you want to learn from it. GPS, wellness and match records — but paper and spreadsheets are fine too. We will tell you what looks possible with what you hold.

  2. STEP 2

    Pilot and refine

    We run it with a limited group and adjust the input fields, the interface and the models.

    A three-stage loop: run, feedback, refine, and back to run. It shows that adjustments are made as feedback comes in. 01 Run 02 Feedback 03 Refine adjusted as feedback comes in
    1. 01Run
    2. 02Feedback
    3. 03Refine

    ↑ back to 01, adjusted as feedback comes in

  3. STEP 3

    Full rollout

    We import your existing and historical data and extend it across the squad.

Tell us what data your club already has.

An initial conversation and a quote cost nothing. “We have data but we are not using it” and “we are struggling with paper and spreadsheets” are both good places to start.

Some photographs on this site are for illustration only.